Sustainability and Climate Action
Lakewood’s Comprehensive Plan supports urban Sustainability and Climate Action by fostering a community culture that commits to creating and maintaining a healthy natural environment that underpins the existence and health of our economy, the industries upon which we rely, and quality of life for current and future generations of all living things. The Plan promotes environmental stewardship and rapid decarbonization to achieve science-based climate commitments.
The Plan’s policies, programs, and practices:
- Mitigate climate change: Reduce greenhouse gas emissions to meet the City’s adopted science-based targets of 60.7% below 2018 levels by 2030 and net zero emissions by 2050. Achieve an interim GHG emissions reduction of 80.4% by 2040.
- Adapt to climate change: Increase community resilience and preparedness to reduce the impacts of climate change, such as extreme heat, flooding, and other climate-related hazards.
2040 Targets to support this Guiding Principle:
- Achieve the interim science-based target of reducing greenhouse gas emissions by 80.4% below 2018 levels to stay on track for net zero emissions by 2050.
- Increase community resilience to the impacts of climate change.
- Reduce energy-related greenhouse gas emissions by a minimum of 80.4% below 2018 levels.
- Minimize waste generation and achieve 90% waste diversion to advance a circular economy and zero waste culture.
- Reduce transportation-related greenhouse gas emissions by a minimum of 80.4% below 2018 levels and expand multimodal transportation options.
- Collaborate with local, regional, and state water service providers and stakeholders to reduce water use on a total and per capita basis.
- Increase tree canopy coverage, improve water quality, enhance biodiversity and utilize nature and nature-based solutions to strengthen and restore natural ecosystems.
- Expand equitable access to clean air, water, and renewable energy.
- Increase resident participation in climate action, especially through the Sustainable Neighborhoods Program and youth engagement initiatives.
What does Sustainability mean? Sustainability means creating a just and rightful balance between the environment, our economy, and an equitable society. Sustainability is not an end goal, but a holistic approach to decision-making that ensures short term needs do not inequitably outweigh the long-term viability of our planet and future generations who will live on it.
What does Climate Action mean? Climate Action refers to strategies and actions that reduce greenhouse gas emissions (mitigation) and/or that enhance resilience (adaptation) to the impacts of climate change.

Greenhouse Gas Emissions
Metric description: Greenhouse gases (GHG) are gases like carbon dioxide and methane that trap heat in the Earth’s atmosphere. They help regulate the planet’s temperature, but rising levels from human activities are causing the climate to warm more rapidly than ever before. A community GHG inventory measures the total emissions generated within Lakewood from three major sources: buildings (such as homes and offices), transportation (such as cars and buses), and waste (such as landfill waste and yard debris).
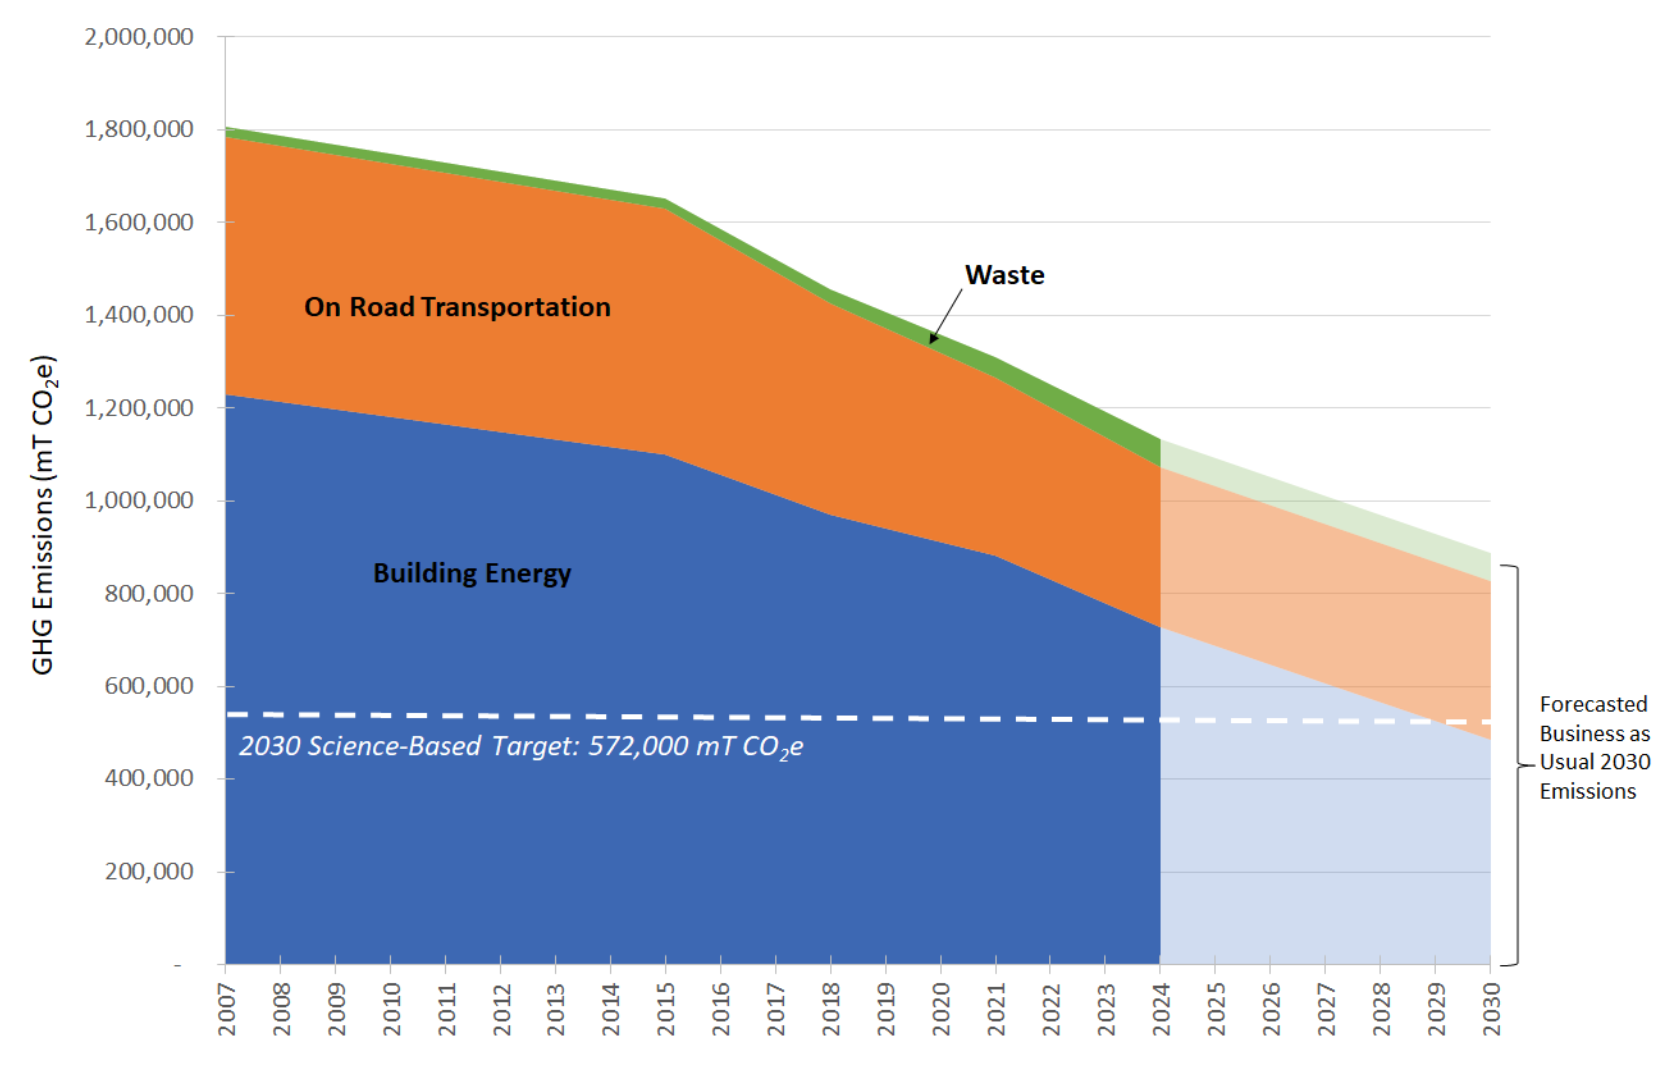
Why it matters: Greenhouse gas (GHG) emissions inventories provide Lakewood leaders, community members, and city staff with a snapshot of carbon emissions created by residents, businesses, institutions, and industries. This helps understand the existing state of Lakewood’s carbon emissions and inform decisions on where to focus climate change-related policies and programs. By comparing inventories over time, we can track progress of climate mitigation efforts towards achieving the adopted Comprehensive Plan targets.
Baseline: 2018 emissions – 1,455,552 mT CO₂e
Target: Reduce GHG emissions to achieve net zero by 2050 (interim targets: 60.7% reduction by 2030, 80.4% reduction by 2040).
Data sources: Lakewood Communitywide GHG inventory from Lakewood Sustainability Division
Methodology: Estimated emissions are calculated using data from multiple sources, including utilities, transportation agencies, and waste haulers, in accordance with the Global Protocol for Community-Scale GHG Emissions (GPC).
Current status (2026 update): The 2024 GHG Inventory shows that Lakewood’s overall GHG emissions have decreased by 22% since 2018. Building emissions have decreased by 25% and transportation emissions have decreased by 24%. Waste emissions appear to have increased, primarily due to changes in how waste volumes are calculated. This will continue to be monitored going forward.
Data: 2018 baseline emissions – 1,455,552 mT CO₂e. 2024 emissions – 1,133,511 metric tons CO₂ equivalent (mT CO₂e). 2030 target emissions – 572,032 mT CO₂e.
Data year: 2024
Update frequency: Approximately every 3 years
Links:
- PDF – Lakewood 2024 Greenhouse Gas Inventory Report
- Interactive Dashboard – Lakewood – Climate Action Plan for 2030
Sustainable Neighborhood Participation
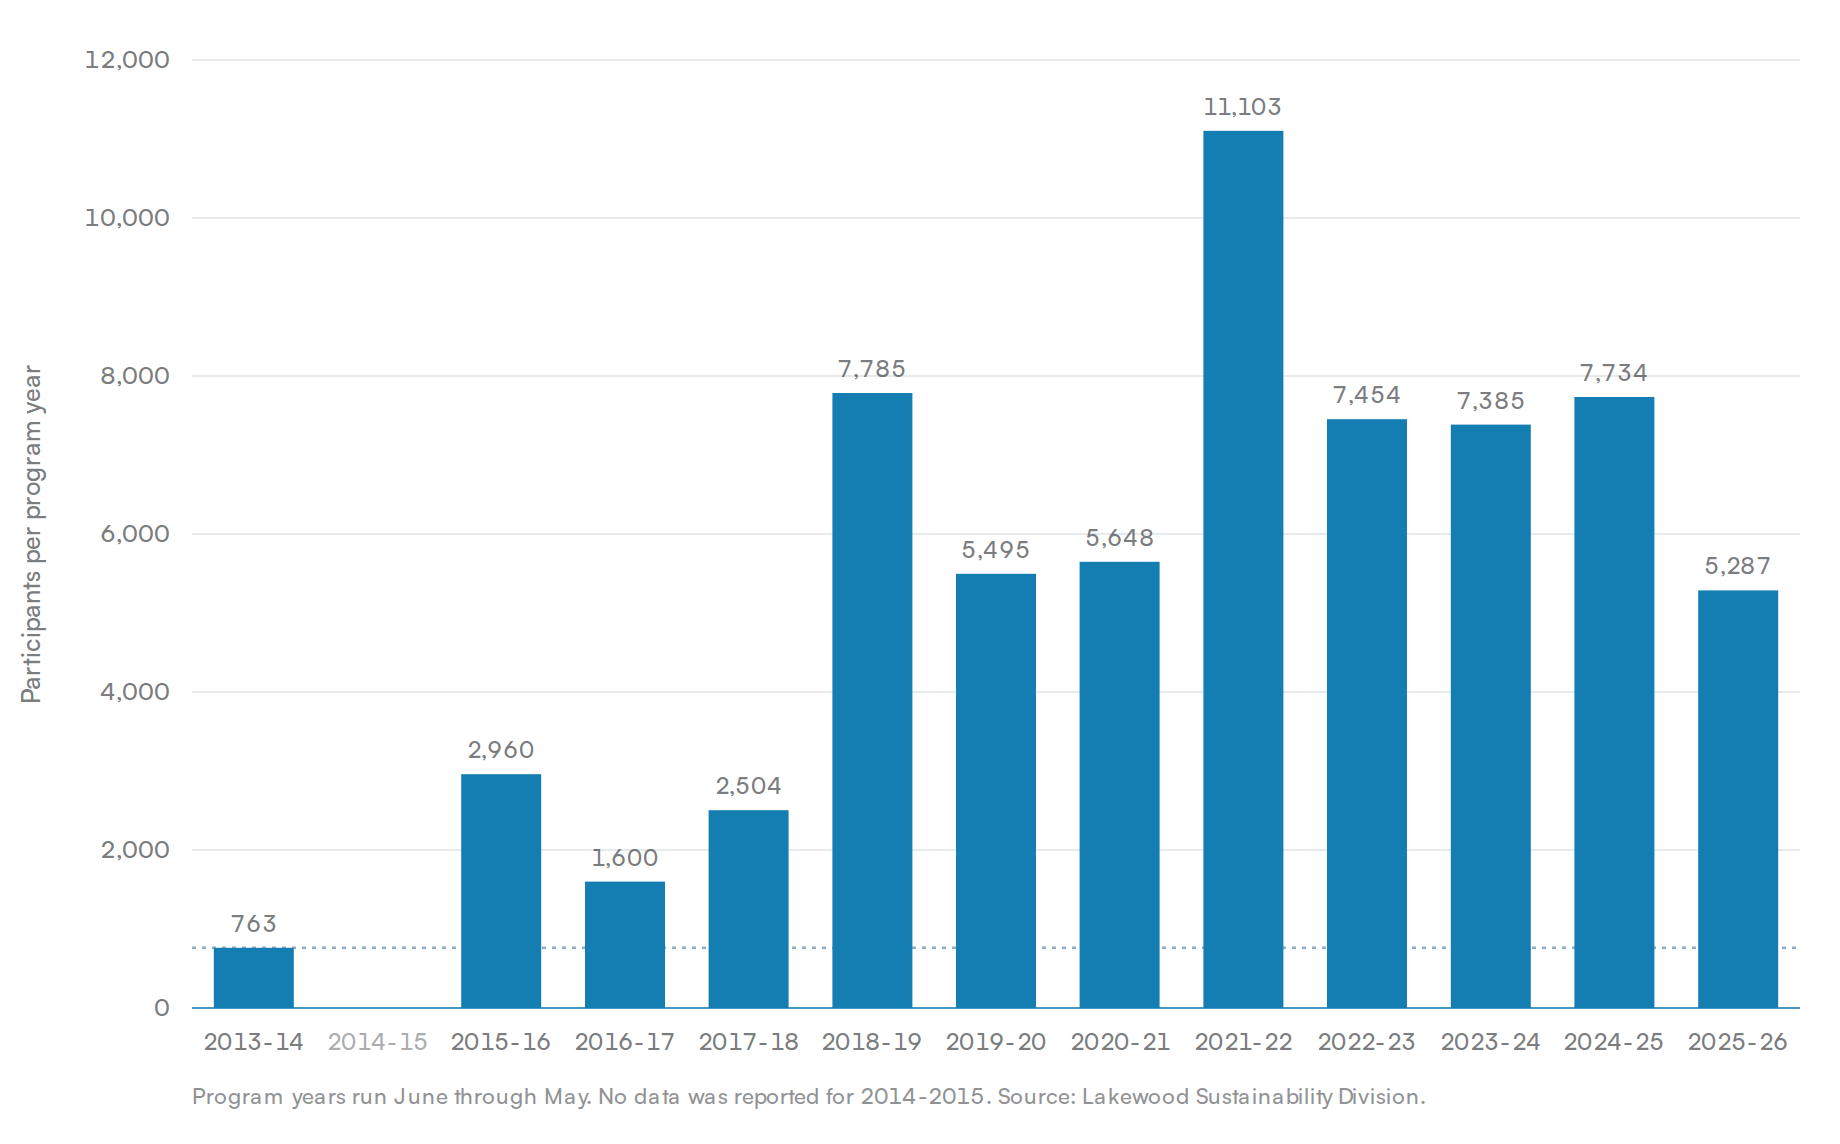
Metric description: The Sustainable Neighborhoods Program started in Lakewood in 2012 with just two neighborhoods, and has since grown to a total of 13 participating neighborhoods. This volunteer-driven program gives residents the opportunity to become active partners in making Lakewood a vibrant and sustainable community with support from city staff. Residents organize workshops, projects, and events that enhance the livability of their neighborhood and reduce their ecological footprint. This metric measures the number of participants in Sustainable Neighborhoods Program activities each year. Since the program is driven by the community, participation often fluctuates based on volunteer capacity.
Why it matters: The Sustainable Neighborhoods Program exemplifies building a community culture of sustainability and stewardship. It actively supports residents living healthy and sustainable lifestyles, connecting with their neighbors, and reducing their environmental impact. Program participation can enhance the environmental and social strength of a neighborhood while demonstrating commitment to sustainability in Lakewood. Measuring participation in the program helps us learn about community sentiments around sustainability topics, how to better engage with the Lakewood community as a whole, and is an indicator of community cohesion and resilience.
Baseline: 2013-2014 – 763 participants in 3 neighborhoods
Target: Increase number of participants in Sustainable Neighborhoods Program each year.
Data Sources: Lakewood Sustainability Division.
Methodology: Cumulative participants at Sustainable Neighborhoods Program events, workshops, meetings, and other activities for each program year (June through May).
Update Frequency: Annually in fall/winter.
Current Status: In the June 2025 – May 2026 program year, the 10 Sustainable Neighborhoods achieved total participation of 5,287 people in 160 activities throughout the program year. In 2026, the Sustainable Neighborhoods program welcomed 3 new neighborhoods: Linda Vista, Union Square, and Westgate. Their first year of participation will be reported in fall 2027.
Data: 2025-2026 – 5,287 participants in 10 neighborhoods
Resilience
Placeholder text for the Resilience measure. City of Lakewood will describe how the community prepares for and recovers from extreme heat, drought, wildfire, severe storms, and other hazards. The final narrative is expected to rank those hazards locally, note which are worsening, describe the systems the city relies on during an event, including power, water, transportation, and cooling and warming centers, and cover natural features that reduce risk, such as tree canopy and stormwater capacity. Data and a chart or dashboard are to be provided, with the source and last-updated year for each indicator; some are reported at the county level rather than the city. Until the City supplies verified figures, the numbers shown here are illustrative only and should not be cited.
Waste Diversion
Metric description: All goods and materials (including food scraps, clothing, home goods, building materials, electronics, packaging, containers, etc.) must go somewhere when we are done using them and they become waste. Most waste is buried in landfills, which have limited space, take up valuable land, and create greenhouse gas emissions as materials break down. Diverting waste from landfills means using alternative methods to dispose of goods and materials without sending it to landfills. Examples of these methods include reuse, repurposing, recycling, and composting. Waste diversion is measured as the percentage of all waste each year that is disposed using a method other than a landfill. It is also referred to as a waste diversion rate.
Why it matters: Global consumption of materials has increased 3 times in the last 50 years. This increasing consumption makes a big difference in the amount of the resources used, environmental impacts created, and waste produced. It takes significant amounts of energy, land, and water to produce, transport, consume, and dispose of the goods we use every day. Waste diversion strategies can lessen the environmental impact and diversify the local economy by circulating materials as many times as possible before they reach the end of their useful life. The national average diversion rate is 32%. Colorado’s diversion rate has remained flat at around 16% since 2019. Understanding how much waste we have and tracking the percentage diverted from landfills helps Lakewood leaders, community members, and staff identify where to focus resources to increase waste diversion.
Baseline: 10% waste diversion in 2024
Target: 90% waste diversion by 2040
Data Sources: Lakewood Communitywide GHG inventory from Lakewood Sustainability Division, Colorado Department of Public Health and Environment (CDPHE).
Methodology: Diversion rate % is calculated as the municipal solid waste diverted (recycled or composted) divided by the total municipal solid waste generated (disposed, recycled, and composted). Detailed methodology for waste estimates available in Lakewood Communitywide GHG inventory from Lakewood Sustainability Division.
Update Frequency: Every 3 years as part of the Lakewood Communitywide GHG Inventory.
Current Status: 2024 is the first year for which a Lakewood-specific diversion rate was calculated, which will be used as the baseline going forward. Previously, staff relied on CDPHE’s diversion rate for the overall Front Range Region, which encompasses all counties along the urbanized corridor from Fort Collins to Pueblo and includes several jurisdictions with strong waste diversion programs. This likely explains why the Lakewood diversion rate is lower than the regional average.
Data: 2024 Lakewood diversion rate – 9.7%
Links:
- Lakewood’s zero waste programs: Zero Waste and Circularity - City of Lakewood, CO
- Learn more about waste in Colorado: Waste diversion totals | Colorado Department of Public Health and Environment
- What does striving to become a Zero Waste community mean? Zero Waste Community Principles - Zero Waste International Alliance
Water Usage
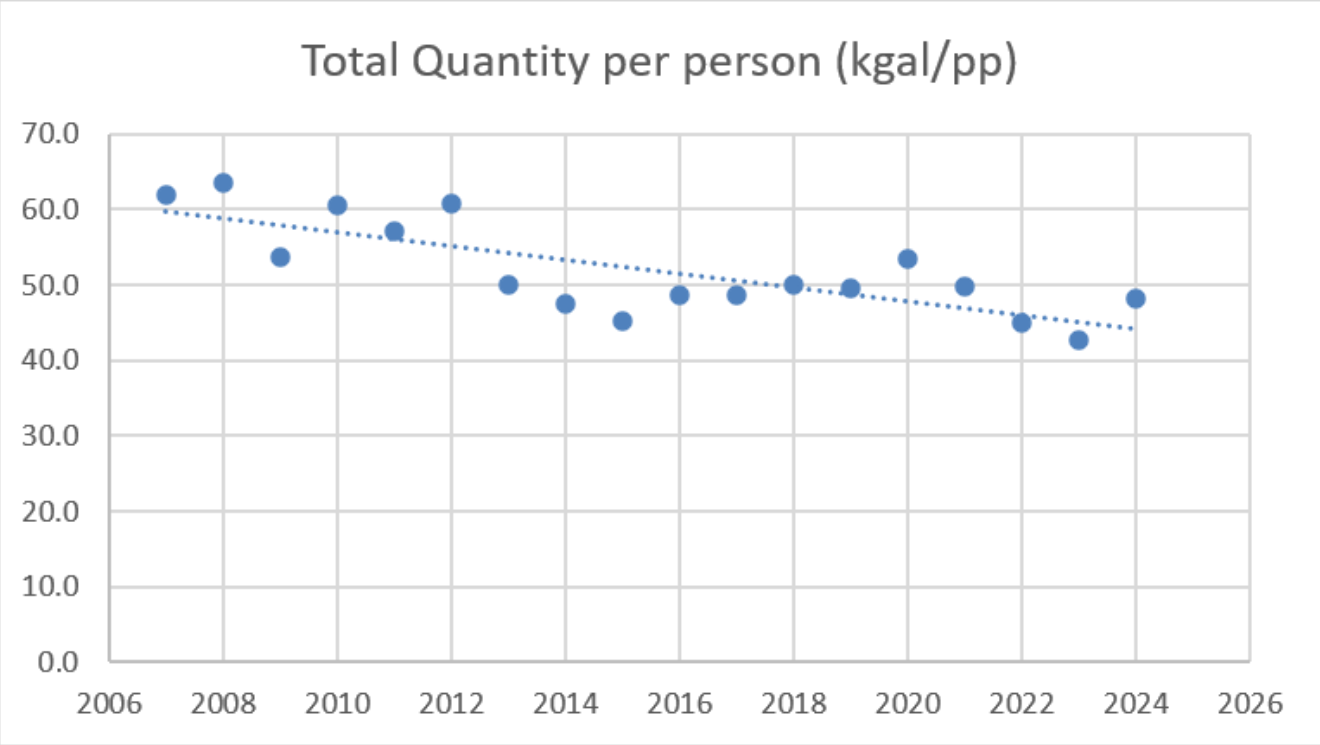
Metric description: Total gallons of water consumed in all water districts serving Lakewood, as well as gallons of water used per person in Lakewood. Most potable (drinking) water in Lakewood is provided by Denver Water, distributed through over 20 smaller water districts.
Why it matters: Water is a limited yet necessary resource in our arid climate. We use it to drink, to clean, to irrigate landscaping, and to grow food. Most of our water supply comes from winter snowpack which flows from surface water sources like creeks and rivers through pipelines and is stored in reservoirs. It is important to monitor how much water we use, both in the overall community and on an individual basis, to identify opportunities to conserve water and ensure adequate water supply is available during droughts.
Baseline: 2010 – 8,675,457 kgal and 60.6 kgal/capita
Target: Reduce gallons of water used per capita and total citywide.
Data Sources: Denver Water, Lakewood Sustainability Division.
Methodology: Total gallons used is provided by Denver Water as the combined amount supplied through their master meters with local water providers. Average gallons per capita is calculated by dividing the total gallons used by the population served through those master meter water providers. Units expressed as kgal (thousands of gallons).
Update Frequency: Annually, as data becomes available from Denver Water.
Data: 2024 – 156,865 kgal and 48.3 kgal/capita